Harlingen Strengthens Rio South Texas Region with All-America City Honor
July 15, 2026
Saronic Technologies’ $3.2 Billion Autonomous Shipyard Investment Marks a New Industrial Era for Brownsville
July 17, 2026
In the latest U.S. trade rankings, Vietnam has surpassed Mexico.
Over the twelve months ending in May, the United States recorded a goods trade deficit of approximately $204 billion with Vietnam, compared with $199 billion with Mexico.
China, once the unquestioned leader in this category, has fallen sharply in the official statistics. The U.S. trade deficit with China has not simply disappeared. Much of it has moved, changed its country-of-origin label, or become embedded in products assembled elsewhere in Asia.
Vietnam sells more to the United States than it buys back. China remains embedded in Asian supply chains. Mexico buys American products, incorporates them into regional manufacturing, and sends value back across the border.
That is why the headline ranking does not tell the full story.
The U.S. goods deficit with China fell from approximately $418 billion in 2018 to $159 billion by May 2026. Annual U.S. imports from China dropped from more than $500 billion to approximately $264 billion.
On paper, China moved from the top of the deficit ranking to behind Vietnam, Mexico, and Taiwan. In practice, a significant part of Chinese industrial participation did not disappear. It changed routes.
Some products have been shipped through third countries and relabeled before entering the United States. U.S. customs investigations have identified cases involving products such as solar cells and steel that were routed through Vietnam without undergoing enough transformation to qualify as genuinely Vietnamese.
China now supplies roughly 40% of Vietnam’s imports, including semiconductors, electronic components, machinery, textiles, and other materials used in products later exported to the United States.
The United States imports significantly more from Vietnam than it exports back. According to the figures presented, total two-way trade with Vietnam reached approximately $221 billion, far below the scale of the U.S.-Mexico relationship.
More importantly, Vietnam’s export platform remains closely connected to Chinese suppliers.
This creates a key distinction:
- A product exported from China is principally supported by a Chinese production system.
- A product assembled in Vietnam may still contain a substantial share of Chinese components and materials.
- A product exported from Mexico frequently contains U.S., Canadian, and Mexican value created through a shared regional supply chain.
A dollar of deficit with Vietnam and a dollar of deficit with Mexico may look identical in the trade statistics. They are not economically equivalent.
Mexico Does What Vietnam and China Do Not: It Buys American Back
The United States imported approximately $558 billion in goods from Mexico during the measured twelve-month period.
But Mexico also purchased approximately $359 billion in U.S. goods.
Many of those products enter manufacturing processes in Mexico and later return to the United States as part of vehicles, appliances, medical devices, electronics, aerospace components, and other finished goods.
The production process does not belong exclusively to one country. It is shared.
Compared with approximately $221 billion in total two-way goods trade with Vietnam, the U.S.-Mexico relationship reached around $917 billion. Mexico’s bilateral trade is not only much larger; it is also significantly more reciprocal.
Three Countries, Three Different Trade Relationships
Placing China, Vietnam, and Mexico under the same trade-deficit ranking obscures three very different economic models.
China: the deficit that changed address
China’s direct exports to the United States have fallen sharply, but Chinese components, capital goods, materials, and supplier networks remain embedded in products exported through other Asian economies.
Vietnam: the fast-growing Asian production platform
Vietnam has expanded its own manufacturing capabilities and attracted production displaced from China. However, its industries remain strongly dependent on Chinese inputs, while its purchases of American goods are comparatively limited.
Mexico: the integrated North American partner
Mexico both sells to and buys from the United States at an unmatched scale.
Approximately 74 cents of every dollar in Mexico’s manufactured exports to the United States reflects North American content, combining inputs, labor, technology, and production from the United States, Mexico, and Canada.
Mexico’s exports are not merely arriving in North America.
They are largely made by North America.
The Deficit Measures a Gap, Not the Value Inside the Trade
Traditional deficit statistics subtract exports from imports. They do not explain where a product’s components came from, how many times those components crossed a border, or how much economic activity the production process generated in each country.
That limitation is especially important when measuring U.S.-Mexico trade.
A U.S.-made auto part may cross into Mexico, be incorporated into a larger component, return to the United States for additional processing, and cross the border again as part of a finished vehicle.
Each crossing generates activity for manufacturers, logistics companies, customs brokers, warehouses, ports, railroads, suppliers, and workers.
A conventional deficit calculation records the final value of the traded goods.
It does not capture the full regional production cycle behind them.
The Rio South Texas Region Makes the Difference Visible
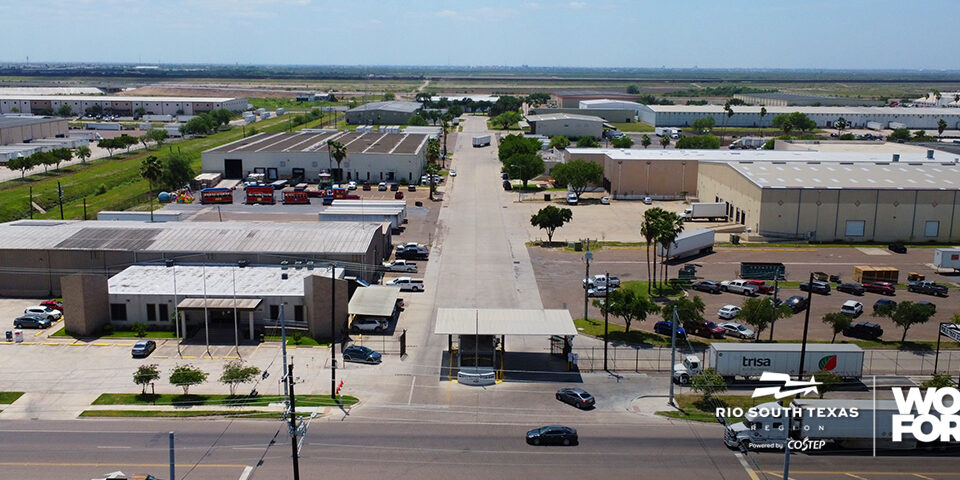
This integration can be seen every day throughout the Rio South Texas Region.
From Brownsville to Laredo, loaded trucks move north and south through international bridges, ports, highways, rail connections, industrial parks, and logistics facilities.
Laredo alone handles approximately 40% of all U.S.-Mexico trade.
The flow is continuous because the region is not simply moving imports into the United States. It is connecting different stages of one North American production system.
Materials travel south.
Components return north.
Machinery, fuel, technology, and agricultural products move into Mexico.
Finished and intermediate goods move back into the United States.
This is not a one-way import corridor.
It is a two-way industrial platform.
The Strategic Question for North America
As the United States evaluates its trade relationships, the most important question should not be limited to which country generates the largest bilateral deficit.
The more meaningful questions are:
Where is the value created?
Which countries buy American products in return?
Which supply chains strengthen North American industry?
Which partners reduce strategic dependence on distant and less transparent production networks?
By those measures, Mexico’s position is clear.
Vietnam’s deficit may now be larger, but its production remains closely connected to Chinese inputs. China may have fallen in the official rankings, but it continues to operate inside the supply chains of other Asian exporters.
Mexico is different.
Mexico purchases hundreds of billions of dollars in American goods, integrates them into regional manufacturing, and creates value that returns to communities and industries on both sides of the border.
Only Mexico buys American back.
Rio South Texas Region: One Region, Two Countries, One Future.


This article was developed by Rio South Texas Region based on analysis and insights originally presented by Daniel Covarrubias in his article, “Vietnam Passed Mexico on the Trade Deficit. It Missed the Story.” The content has been adapted and expanded to provide additional context on North American supply chains and the strategic role of the Rio South Texas Region.